
AFM phase imaging fills that gap. It's a nondestructive tapping-mode technique that picks up on viscoelastic and adhesive differences between materials, making it especially useful for polymer blends, copolymers, and nanocomposites where components look identical in topography but behave very differently at the tip-sample interface.
This article breaks down how phase imaging works, where it delivers the most value in polymer research, how it stacks up against other AFM modes, and what to look for in a system if you're doing this work regularly.
Key Takeaways
- Phase imaging maps viscoelastic and adhesive contrast, not height, revealing composition invisible in topography
- Primary uses span polymer blends, copolymers, biopolymers, and nanocomposite fillers
- Results are qualitative, not quantitative: relative differences, not exact modulus values
- Modular tapping-mode AFM systems with stable electronics are essential for repeatable contrast
What Is AFM Phase Imaging?
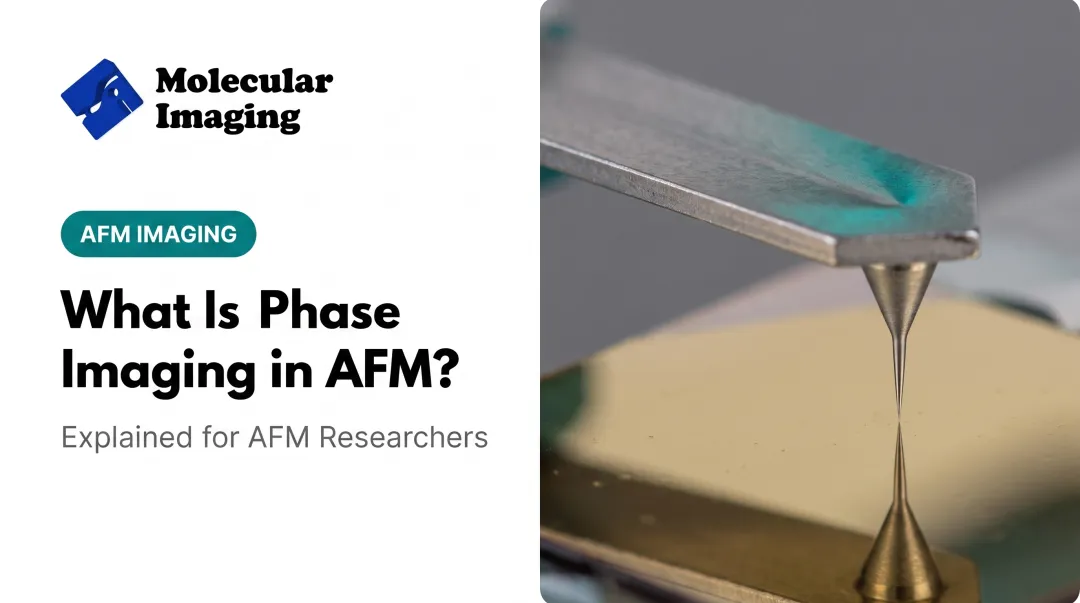
Phase imaging is a tapping-mode AFM technique that measures the phase lag between the cantilever's drive signal and its actual oscillation response. As the tip taps the surface, differences in stiffness, adhesion, or energy dissipation shift that phase lag (Bruker's PhaseImaging Mode overview explains this well).
What types of images does an AFM produce? Three, typically, all collected during the same scan:
- Height images — surface topography, the classic AFM output
- Amplitude images — oscillation amplitude, often used for feedback tuning
- Phase images — the phase lag signal, sensitive to material properties rather than shape
What are phase images in AFM, in plain terms? They're maps of where the tip hit stiffer or softer regions, and more or less adhesive ones. Bright and dark contrast corresponds to relative material differences, not absolute values.
One caveat: phase imaging is qualitative. It tells you domain A differs from domain B — it doesn't hand you a modulus number for either one.
How AFM Phase Imaging Works for Polymer Analysis
In tapping mode, the cantilever oscillates near its resonance frequency and lightly taps the surface on each cycle, rather than dragging across it. That setup answers a common question—how does AFM imaging work—in plain terms: intermittent contact plus a feedback loop that holds oscillation amplitude constant while the tip traces the surface.
Phase contrast emerges from that tapping interaction. When the tip crosses from a crystalline polymer domain into an amorphous one, or from a stiff filler particle into a soft matrix, local stiffness and adhesion change, and so does the phase lag.
Probe Selection Matters More Than You'd Think
Tip selection and condition directly affect contrast quality:
- Soft, low-frequency tips (like an FM-10-style cantilever) reduce imaging force on delicate polymer surfaces
- Mid-frequency tips balance resolution and stability for general polymer morphology work
- Contaminated tips create false multi-point artifacts that mimic compositional features
Tip condition should be verified before drawing conclusions about small polymer domains — a worn or dirty tip can produce contrast that looks like chemistry but is really just an artifact.

Environmental Sensitivity Is Real
NIST researchers found that phase contrast on hydrophilic/hydrophobic polymer surfaces was weak at low relative humidity and increased substantially at higher humidity, because adsorbed moisture changes tip-sample interaction forces. In a PS-b-PEO block copolymer study, higher humidity actually increased contrast tied to swelling in the PEG-rich domains.
Temperature drift creates its own problems: it can shift the region of interest mid-scan and change cantilever amplitude sensitivity, forcing setpoint readjustment. That is why environmental control accessories, such as temperature-controlled stages, matter for repeatable polymer phase work.
Darker or lighter phase regions typically map to softer or stiffer material, but the direction depends on scan parameters. Always check setpoint and amplitude settings before assuming which shade means hard versus soft.
Key Applications of Phase Imaging in Polymer Research
Phase imaging matters in polymer labs because it reveals what topography can't.
Polymer Blends and Block Copolymers
A 2023 study examining FDM-printed ABS and PLA filaments used phase imaging to detect blend homogeneity. Results showed phase contrasts of 137 degrees for PS/SBS blends versus just 12 degrees for a homogeneous PLA sample, a measurable difference topography alone would have missed (Werner et al., 2023).
Earlier work on polystyrene/polybutadiene thin films confirmed that phase contrast depends heavily on force setpoint — good contrast appeared only within a specific force range, and it degraded as the PB component oxidized over time.

Crystalline vs. Amorphous Regions
Phase imaging has captured polyethylene crystals mid-melt, revealing substructure invisible in height data. This makes it a valuable tool in polymer crystallization studies, though it works best as a contrast-generation tool rather than a strict crystalline/amorphous calibration method.
Nanocomposites and Filler Distribution
Phase contrast highlights filler particles against a polymer matrix and can flag interface quality. Areas where the filler-matrix bond is poor often show distinct adhesion signatures. A 2024 coating study used phase imaging to distinguish regions of differing compliance at air-epoxy and epoxy-substrate boundaries. The same contrast is useful for:
- Materials science R&D groups screening filled polymers
- Core facilities running thin-film and nanostructure samples across many projects
- Coating researchers mapping epoxy and other polymer interfaces
Limitation: Chemical Identity
Phase contrast in polymer solar cell research has been used to study bulk heterojunction morphology, but researchers have cautioned that phase contrast alone can't reliably identify which chemical component occupies a domain. It is a strong hypothesis-generating tool. Pair it with complementary chemical methods when identity matters.

Phase Imaging vs. Other AFM Modes for Polymers
| Technique | What it measures | Best for |
|---|---|---|
| Topography (height) | Surface shape | Samples with clear physical height differences |
| Phase imaging | Relative stiffness/adhesion contrast | Low-height-contrast blends, copolymers, composites |
| Nanoindentation/force mapping | Quantitative modulus, adhesion | When exact mechanical values are required |
| AFM-IR | Chemical/infrared absorption | Confirming chemical identity of domains |
Choose the mode based on the answer you need:
- Phase imaging — materials look nearly identical in height but differ in stiffness or adhesion
- Nanoindentation / force mapping — you need quantitative modulus or adhesion values, not just contrast
- AFM-IR — you need chemical identity of domains
- Conductive AFM — you need electrical contrast phase imaging cannot supply on its own
A practical workflow many labs follow: screen with phase imaging first to locate domains quickly, then follow up with force mapping or AFM-IR where quantitative or chemical answers are needed.
Choosing the Right AFM System for Polymer Phase Imaging
Reliable phase contrast depends less on marketing specs and more on core system stability. Look for:
- Modular tapping-mode capability: stable drive amplitude and setpoint control; phase signal is sensitive to both
- Cantilever flexibility: soft, low-frequency probes for delicate polymer surfaces; mid- or high-frequency options for general morphology
- Low-noise electronics: phase is a small dynamic signal recorded alongside active topography feedback
- Environmental control accessories: temperature-controlled stages and isolation chambers for humidity and drift control in polymer phase studies Molecular Imaging's 5500 PicoPlus AFM+STM platform is documented for tapping-mode polymer work, including block copolymer imaging under toluene vapor and PMMA morphology studies at varying engagement force. That modular configuration covers a wide range of polymer sample types in one system. Temperature-controlled stages run from -30°C to 250°C for phase-transition studies, and environmental isolation chambers manage humidity and gas conditions relevant to polymer analysis. Cantilever options include soft low-frequency probes, mid-frequency general-purpose tips, and liquid-imaging cantilevers for hydrated biopolymer samples. Labs running these systems long-term can use ZoomAFM repair and maintenance support for diagnostics, calibration, and platform-matched parts replacement, helping keep phase contrast measurements consistent over years of operation.

Frequently Asked Questions
How does AFM imaging work?
The cantilever oscillates near resonance and intermittently taps the sample surface. A feedback loop maintains constant amplitude while tracking the tip's position, generating topographic and phase signals simultaneously.
What types of images does an AFM produce?
AFM produces height (topography), amplitude, and phase images in a single scan. Height shows shape, amplitude reflects feedback stability, and phase reveals material property contrast.
What are phase images in AFM?
Phase images map the phase lag between the cantilever's drive signal and its oscillation response. They highlight relative differences in stiffness or adhesion across a sample's surface.
Can AFM phase imaging quantify polymer stiffness precisely?
No. Phase imaging is qualitative — it shows relative differences, not absolute values. For precise modulus numbers, use nanoindentation or force-mapping techniques like PeakForce QNM.
What types of polymers benefit most from phase imaging analysis?
Blends, block copolymers, filled composites, and biopolymers with mixed-material surfaces benefit most. These samples often show weak height contrast but strong mechanical property differences.
Do environmental conditions affect AFM phase imaging results on polymers?
Yes. Humidity and temperature both influence phase contrast, sometimes significantly. Temperature-controlled stages and isolation chambers improve repeatability for sensitive polymer samples.