
Many of these incidents trace back to gaps in material characterization, not design flaws. A folded anode tab. A trace contaminant that slipped past QC. An SEI layer that grew unevenly during cycling. Analytical rigor catches these problems before they become recalls.
This guide breaks down the core techniques battery labs use — from elemental analysis to nanoscale surface imaging — and shows how to match the right method to each stage of the battery lifecycle.
TL;DR
- Elemental, structural, chemical, and electrochemical methods cover battery work from R&D through QC and recycling
- ICP-OES/MS, XRD, SEM, Raman, XPS, and AFM each map a different layer of composition, structure, or degradation
- Match the method to the stage: throughput for manufacturing QC, mechanistic depth for R&D
- Pair bulk techniques with nanoscale imaging for the most complete degradation picture
What Is Lithium-Ion Battery Analysis?
Lithium-ion battery analysis is the set of methods used to evaluate the composition, structure, and performance of battery materials and cells. It shows up across the entire value chain:
- Raw material QC — verifying cathode powder purity before it reaches production
- In-process manufacturing checks — catching coating defects or contamination early
- R&D formulation — testing new chemistries like cobalt-free cathodes
- Failure investigation — determining why a cell batch underperformed
- Recycling — confirming recovered metals meet purity thresholds
Techniques generally fall along two dimensions: the type of information gathered (elemental, structural, or electrochemical) and the scale of measurement (bulk versus surface/nanoscale). No single method covers everything, which is why labs run several in parallel.
Why Rigorous Battery Analysis Is Critical
Skipping analytical steps risks safety incidents, drives up costs, and slows R&D. NHTSA's LG Energy Solution inquiry documented internal cell failures tied to manufacturing defects, including conditions that could allow lithium plating to contact the cathode. A 2025 review of manufacturing defects links poor electrode alignment, uneven coating, and metal foreign matter directly to degradation and safety risk.
Rigorous analysis:
- Prevents costly recalls by catching impurities before cell assembly
- Improves cycle life predictions through degradation mechanism insight
- Supports safety compliance with standards like IEC 62660 and GB/T 31486
- Enables faster R&D iteration on new chemistries, such as cobalt-free cathodes
- Improves recycling yield and purity verification for circular economy goals
- Strengthens root-cause analysis when field failures occur
Standards such as IEC 62660-3 and GB/T 31486 address cell and cell-block performance, but they do not replace pack-level engineering. Material characterization is what proves the cell actually meets that spec in the first place.
Core Analytical Techniques Used in Battery Labs
Labs typically combine five technique families: elemental, structural/morphological, chemical/molecular, nanoscale surface imaging, and thermal/moisture/gas analysis.
Elemental Analysis
ICP-OES and ICP-MS quantify Li, Co, Ni, and Mn ratios in cathode material, plus trace metal contaminants. Thermo Fisher's application work on ternary cathode material used this method to verify stoichiometry and flag impurities before cell assembly.
Structural & Morphological Analysis
XRD reveals crystal phase, cation mixing, and crystallite size. A 2024 Malvern Panalytical study on NCM111 cathode material found 7% cation mixing and a 92 nm crystallite size via Rietveld refinement — data that directly predicts capacity retention.
SEM and FIB-SEM map morphology from the micrometer down to the nanometer scale. FIB-SEM adds 2D/3D cross-sectional tomography, exposing delamination, cracking, and lithium trapping that surface imaging alone would miss.

Chemical & Molecular Analysis
- FTIR identifies binder chemistry, solvent composition, and LiPF6 breakdown products
- Raman spectroscopy maps SEI composition, carbon structure, and phase distribution
- XPS quantifies surface chemistry and depth-profiles the SEI layer, comparing pristine versus cycled electrodes
Nanoscale Surface Imaging
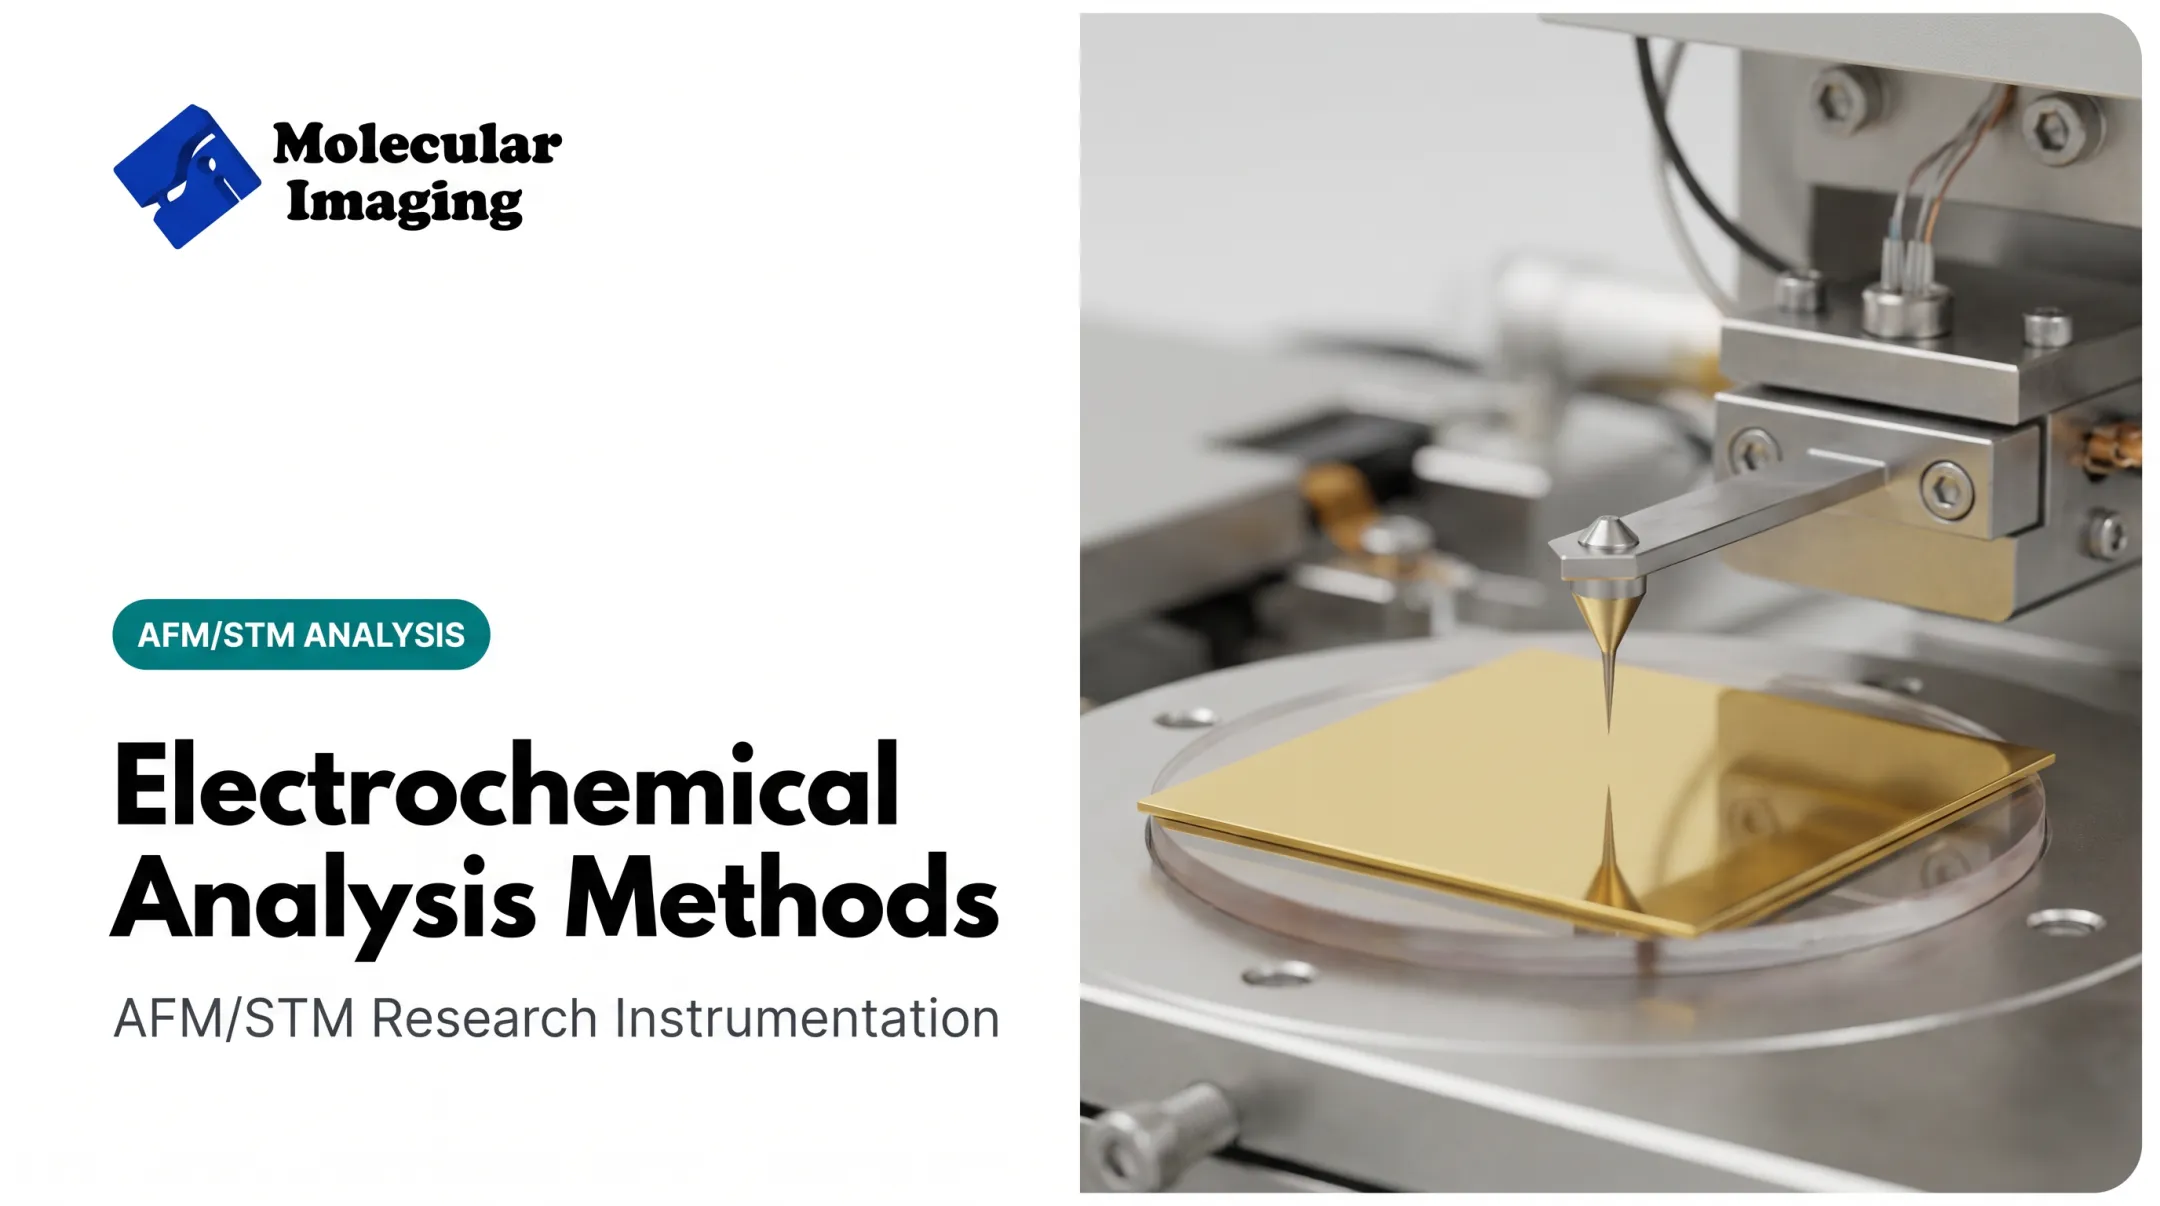
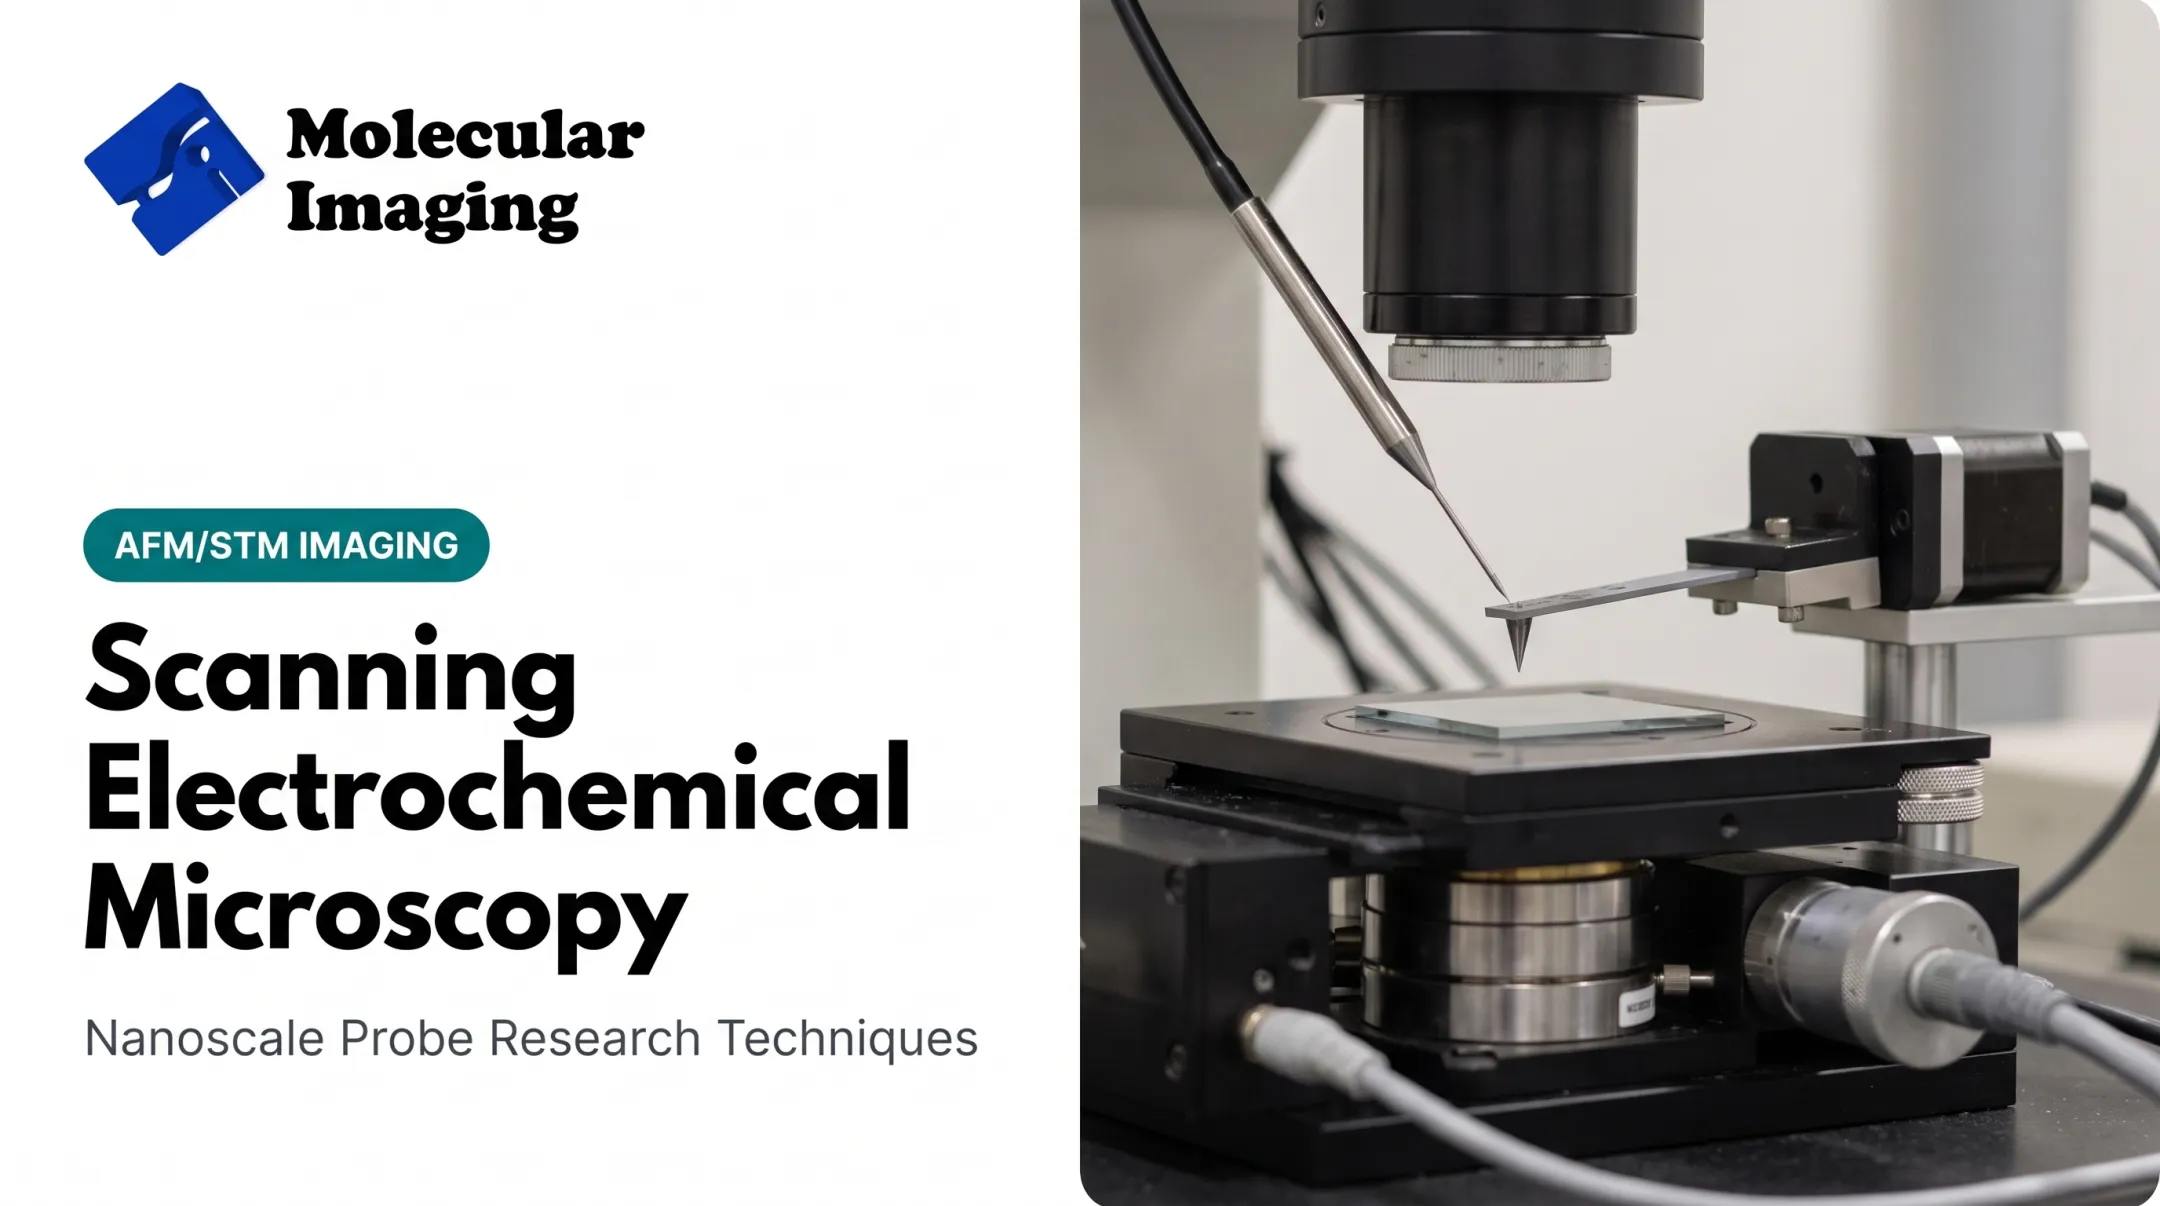
Atomic Force Microscopy (AFM) images electrode surface topography and SEI layer formation without vacuum or extensive sample prep.
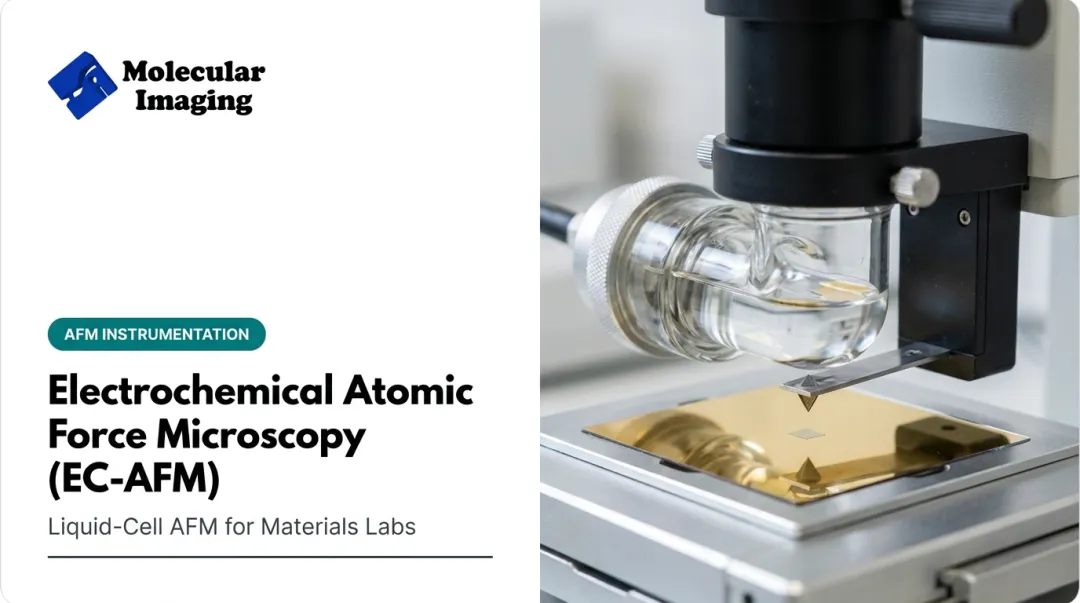
Electrochemical AFM has captured SEI cracking during lithiation in operando studies, which vacuum-based methods like SEM struggle to reproduce. AFM is a strong complement to SEM and XPS for tracking surface evolution cycle by cycle.
Thermal, Moisture & Gas Analysis
- Karl Fischer titration measures moisture content in electrolyte before assembly
- TGA/DSC measure thermal stability and heat flow, supporting thermal-runaway modeling
- GC/GC-MS identify electrolyte breakdown byproducts like DMC, EMC, and FEC

Choosing the Right Technique for Each Lifecycle Stage
Technique selection comes down to one question: do you need speed, or do you need mechanistic depth?
R&D and formulation prioritizes high-resolution, in-situ methods:
- AFM for local surface and mechanical evolution
- Raman for phase and SEI chemistry
- EIS for non-destructive electrochemical response
Quality control and manufacturing prioritizes throughput:
- ICP-OES for rapid elemental screening
- XRD for phase/cation mixing checks
- SEM/EDS for coating defect detection
Recycling and environmental monitoring prioritizes purity verification:
- Handheld XRF to screen incoming black mass for Ni, Mn, Co, and Fe
- Digested ICP-OES/MS for precise Li quantification
The decision rule: use rapid, non-destructive screening for QC. Reserve correlative, depth-resolved, and 3D methods for formulation work and failure analysis.

Battery Analysis Workflow: A Practical Example Walkthrough
Here's a simplified example of investigating unexpected capacity fade in a cell batch.
Step 1: Define the objective. Is the fade coming from cathode degradation, SEI growth, or contamination?
Step 2: Gather inputs. Collect cycled cells, pristine reference cells, aged electrode samples, and production batch records.
Step 3: Apply techniques.
- Run ICP-OES to check for elemental drift versus specification.
- Run SEM and AFM to compare surface morphology against pristine controls.
- Run XPS to characterize interfacial chemistry and SEI thickness.
Step 4: Interpret results. Correlate elemental contamination or SEI thickening with the observed capacity loss.
This mirrors published post-mortem work. A study of Samsung SDI 18650 cells found capacity loss ranging from 10% at 0°C to 20% after 300 equivalent cycles at 45°C. Researchers traced the mechanism with a method stack of SEM, EDX, GD-OES, XRD, and NMR.

Even a solid stack fails if execution slips. Common mistakes to avoid:
- Skipping the bulk-to-surface correlation (elemental data alone won't explain SEI-driven fade)
- Ignoring sample handling artifacts — cells opened in air can oxidize before you even get to the microscope
- Relying on a single technique when the failure mode is ambiguous
In a fade investigation like this one, findings usually drive corrective actions: adjusted electrolyte formulation, tightened raw-material specs, or revised coating parameters.
How Molecular Imaging Supports Battery Materials Research
Studying SEI formation and electrode surface degradation at the nanoscale requires imaging tools that don't disturb the sample. Molecular Imaging builds modular AFM/STM systems built for this work.
The 5500 PicoPlus AFM+STM and 5420 PicoAFM systems support in-situ electrochemical AFM and STM, with liquid-cell imaging suited to monitoring electrode surfaces and SEI-layer development during cycling.
Both integrate with a potentiostat-controlled three-electrode setup, so AFM observations connect directly to electrochemical performance data.
For temperature-dependent degradation studies, Molecular Imaging's Environmental Isolation Chamber and temperature-controlled sample stages cover -30°C to 250°C. That range helps separate thermal effects from atmospheric or moisture-driven degradation.
Other relevant capabilities:
- Modular configuration across the 5500, 5420, and 5400 series, with interchangeable nose cones for AFM, STM, KPFM, and conductive-AFM modes
- Conductive AFM for mapping electrical properties on degraded or heterogeneous electrode surfaces
- Technical docs on electrochemistry, liquid-cell operation, and in-situ AFM of lithium-battery SEI formation in glove-box conditions
- Academic advisory input from Dr. Stuart Lindsay on in-situ imaging methodology in fluids and gases

None of this replaces bulk elemental or structural analysis. It fills the nanoscale surface-imaging gap that SEM and XPS alone can leave open.
Conclusion
Reliable battery analysis depends on combining elemental, structural, chemical, and nanoscale imaging methods matched to the lifecycle stage under study. ICP-OES tells you what's in the material. XRD and SEM tell you how it's structured. AFM and XPS tell you what's happening at the surface where degradation actually starts.
As chemistries shift toward cobalt-free cathodes and solid-state designs, analytical workflows need to evolve too. New chemistries bring new degradation mechanisms, and the technique stack that worked for NMC cathodes won't automatically cover a solid-state interface. Labs that keep surface and interface methods in the core workflow will adapt faster as those mechanisms change.
Frequently Asked Questions
How many years can a lithium-ion battery last?
Lifespan typically ranges from 2 to 10+ years depending on chemistry, temperature history, and usage. Capacity-fade monitoring predicts remaining useful life more accurately than calendar age alone.
What is the 80/20 rule for lithium-ion batteries?
It's a practical heuristic, not a formal standard, where users charge to 80% and discharge to 20% to reduce stress on the cell. This limits time spent at full charge, which slows chemical aging.
What is the most common technique for detecting impurities in battery materials?
ICP-OES and ICP-MS are the standard methods for trace metal detection in cathode and electrolyte materials. Both quantify major elements and contaminants after sample digestion.
Can AFM be used to study battery degradation?
Yes. AFM maps SEI growth and electrode surface changes at the nanoscale. Electrochemical AFM has also captured SEI cracking during cycling in operando studies.
What analytical standards govern lithium-ion battery testing?
IEC 62660 covers performance, reliability, and safety testing for EV traction cells, while GB/T 31486 sets electrical performance requirements in China. Both address cell-level testing, not pack-level engineering.
Why is post-mortem analysis important in battery research?
Disassembling aged cells connects measured capacity fade to physical and chemical causes, such as SEI thickening or active material loss. These findings directly inform next-generation material and process design.