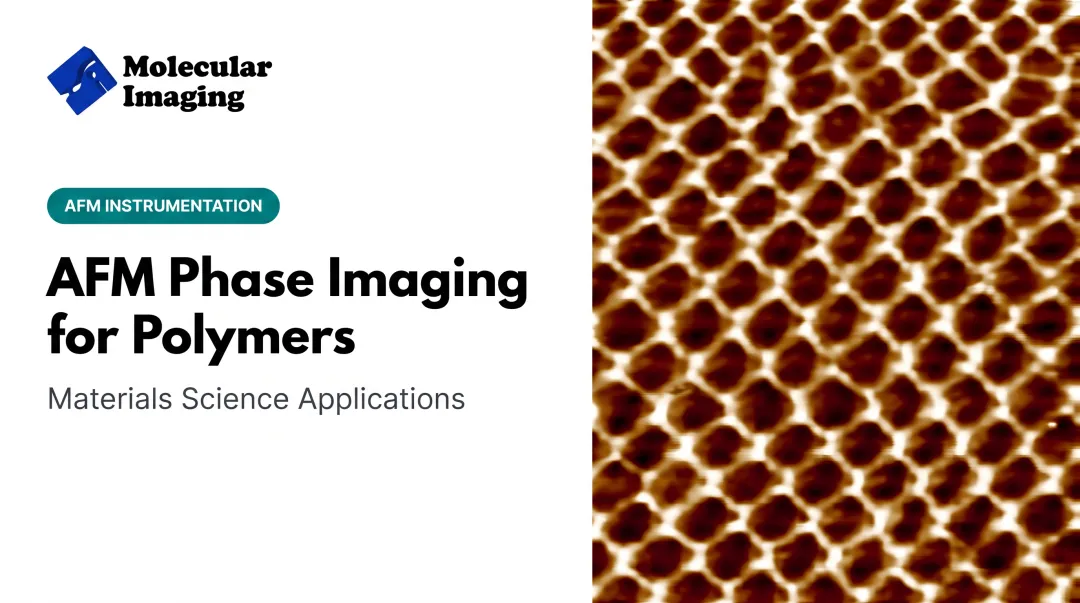

That's the gap phase imaging fills. This AFM technique captures a signal most standard height scans ignore: the lag between the cantilever's drive and its actual oscillation. That lag carries information about stiffness, adhesion, and viscoelasticity, revealing compositional boundaries invisible in a pure topography map.
This article breaks down how phase imaging works, where it's used, how to read the results without over-interpreting them, and what to look for in an AFM system if reliable phase data matters to your research.
Key Takeaways
- Phase imaging records the phase lag of cantilever oscillation in tapping mode, separate from the height channel
- It exposes differences in adhesion, viscoelasticity, and stiffness that topography alone cannot show
- Contrast stays qualitative — slope, contact area, and material properties all mix in the signal
- Used across polymer science, composites, biomaterials, and semiconductor research
What Is Phase Imaging in AFM?
Phase imaging refers to the phase-shift signal captured during tapping mode operation (also called AC mode or vibrating mode). As the cantilever taps the surface, its oscillation lags behind the drive signal by some amount. That lag angle is the phase signal.
This trips people up: phase imaging in AFM has nothing to do with optical phase-contrast microscopy or the phase-contrast imaging used in transmission electron microscopy. Different physics, different instruments, same word.
Phase imaging is not a standalone mode you switch on by itself. It is a second data channel recorded simultaneously with topography whenever an AFM runs in tapping or intermittent-contact mode. One scan gives two maps registered to the same pixels: height and phase lag.
How Phase Imaging Works: The Science Behind the Signal
In tapping mode, the cantilever oscillates near its resonant frequency and lightly taps the surface on each cycle. As the tip encounters the surface, amplitude changes drive the feedback loop that builds the topography image.
The phase channel measures something different: the timing lag between the driving signal and the cantilever's actual mechanical response. On a perfectly uniform, rigid surface, that lag stays constant. Where material properties change, so does the lag.

What Actually Drives Phase Contrast
Several factors contribute to the phase signal, and they don't separate cleanly:
- Adhesion between tip and sample
- Viscoelasticity: how the material stores versus dissipates energy
- Stiffness differences across regions
- Contact area and local slope, which can mimic material contrast on rough surfaces
On flat, uniform samples, phase differences most reliably point to real compositional variation. Once slope enters the picture, interpretation gets murkier.
The Theoretical Groundwork
Tamayo and Garcia's 1997 study on elastic and inelastic interactions in tapping-mode phase contrast established that phase signal depends on both energy-storing and energy-dissipating tip-sample interactions, not a single material property.
A 2003 follow-up study found that phase-angle contrast tracks viscoelastic properties more strongly at high vibration amplitude and low mean tip-sample distance.
A concrete example: in a study of silica-filled silicone elastomer, phase imaging separated silica structures from the surrounding matrix with higher resolution than the height image alone. That is exactly the case where topography shows little and phase reveals the boundary.
What Phase Images Reveal: Applications Across Research Fields
Phase imaging earns its place in a researcher's toolkit by answering the question topography can't: what's different about this region, even when it's flat?
In materials science, phase imaging maps:
- Grain boundaries in thin films and metals
- Multi-component polymer domains in blends and block copolymers
- Filler dispersion in nanocomposites
A study examining PS/SBS polymer blends found height differences too small to interpret, while the phase channel clearly distinguished the two polymer regions. The same study reported similar results in ABS blends, where phase contrast separated components that height imaging couldn't.
In semiconductor research, a study of TiSi2 thin films used tapping-mode AFM with phase imaging to identify triple-point nuclei and C49-phase grains. The phase channel resolved grain-growth features during processing that height imaging alone could not.
In life sciences, phase imaging shows localized, material-sensitive contrast on purple membrane samples in buffer, achieving 1.4-nanometer lateral resolution. That's fine enough to distinguish membrane-level structural features under near-physiological conditions.

In electronics and composites, phase imaging routinely flags contamination regions and maps composite components where chemical identity, not just shape, matters.
The common thread: phase imaging works best as a screening tool that flags where to look closer, not a final chemical fingerprint.
Interpreting Phase Contrast: Strengths and Limitations
Phase contrast is most useful as a relative map of material differences collected with topography. It helps flag domains in polymers, composites, and soft matter without extra hardware.
The honest caveat: that same phase data is usually qualitative, not quantitative.
The phase angle you measure bundles together elastic response, viscous losses, cantilever losses, and indentation hysteresis. A 2021 analysis in Communications Physics warned that at high oscillation amplitudes, these effects can't be cleanly separated, making viscoelastic interpretations unreliable without careful modeling.
Practical guardrails:
- Always compare phase images side-by-side with topography — a phase boundary that tracks an edge might just be slope, not composition
- Flat samples give the most trustworthy phase contrast; rough surfaces introduce ambiguity
- Report your scan conditions (amplitude, setpoint, drive frequency) since they change what the phase signal is actually sensitive to
- Treat phase contrast as a hypothesis generator, not a standalone material identification

Skip the numerical modulus claims unless you're running a calibrated, model-based measurement alongside it.
Phase Imaging vs. Other AFM Modes
Phase imaging complements other AFM techniques rather than replacing them. Each mode answers a different question.
| Mode | What it measures | When to use it |
|---|---|---|
| Contact mode | Surface height only | Basic topography, no composition data |
| Tapping + phase | Height plus material-sensitive lag | Mapping composition, boundaries, heterogeneity |
| Force spectroscopy | Force curves at specific points | Quantifying adhesion or elasticity at a location |
| MFM | Magnetic domain structure | Studying magnetic materials, hard-drive media |
Contact mode gives you shape without composition. Force spectroscopy yields numbers at a single point, not a full map, and MFM only responds to magnetic interactions. Phase imaging covers the gap those modes leave: a spatially complete, material-sensitive map that pairs directly with your height scan.
Choosing an AFM System for Reliable Phase Imaging
Clean phase data depends on the instrument as much as the sample. A few things matter more than others:
- Stable tapping mode electronics: low-noise signal processing keeps the phase channel from drifting during long scans
- Quality cantilevers matched to your sample: a mismatched spring constant or resonant frequency muddies phase contrast before you start interpreting results
- Modular software controls: scripting custom spectroscopy or adjusting acquisition parameters in real time helps you isolate what's actually driving contrast
Molecular Imaging's AFM/STM platforms, including the 5500 PicoPlus AFM+STM, support tapping mode through modular nose cones. The same systems also cover STM and specialized modes such as MFM and KPFM.
For cantilevers, the NCL-30-10 Mid Frequency Tapping Cantilever offers a practical balance of resolution and stability for general phase work in air. Liquid-compatible options like the Si-L-10 support biological samples in aqueous conditions.
For labs already running Agilent 5500 or 4500 systems, ZoomAFM provides calibration, diagnostics, and remote troubleshooting so existing instruments keep producing reliable phase data without a full system replacement.
Frequently Asked Questions
What is an AFM microscope?
An atomic force microscope is a scanning probe instrument that uses a cantilever tip to map surface topography and material properties at the nanoscale. It works on virtually any surface, conductive or not.
How does AFM imaging work?
A sharp tip on a flexible cantilever interacts with the sample surface through forces like attraction and repulsion. A feedback loop adjusts the tip-sample distance to maintain a constant interaction, and that adjustment builds the topography map.
What is the difference between STM and AFM?
STM relies on a tunneling current between a conductive tip and a conductive sample, so it only works on conductive surfaces. AFM measures force-induced cantilever deflection, making it usable on virtually any material.
How accurate is AFM?
AFM can achieve nanometer to sub-nanometer resolution under ideal conditions, but accuracy depends heavily on tip geometry, calibration, and environmental stability. Always treat resolution claims as instrument- and sample-specific, not universal.
Is phase imaging quantitative or qualitative?
Phase contrast is generally qualitative because adhesion, stiffness, viscoelasticity, and contact area all contribute to the same signal. Extracting quantitative material properties requires calibrated, model-based analysis, not raw phase angles.
Can phase imaging be done on any AFM system?
Phase imaging requires tapping or intermittent-contact mode capability, which isn't universal across every AFM platform. Systems like Molecular Imaging's 5500 PicoPlus AFM+STM support tapping mode through modular nose cones, enabling phase data collection alongside topography.