
Standard Vickers or Rockwell tests rely on optical measurement of an indent left in a surface. That approach works fine for bulk metals, but it falls apart when the sample is a 200 nm thin film, a small biological sample, or a localized region within a multi-phase alloy. The indenter punches too deep, the optics can't resolve the mark accurately, or the substrate underneath skews the result entirely.
This guide breaks down what nanoindentation is, how the underlying Oliver-Pharr method works, where it delivers real value in research and quality control, and how instrumentation choices affect the reliability of your data.
TL;DR
- Nanoindentation measures hardness, elastic modulus, creep, and fracture toughness at nanometer-scale depths using continuous load-displacement data
- The Oliver-Pharr method replaces optical indent measurement with mathematical analysis of the unloading curve
- Applications span semiconductors, coatings, biomaterials, polymers, and thin films
- Tip geometry, calibration, and instrument sensitivity are the biggest drivers of reliable results
What Is Nanoindentation?
Nanoindentation is a depth-sensing indentation technique. Instead of measuring the size of a leftover impression, it continuously records force and penetration depth throughout the entire test cycle. Under ISO 14577-1, this places it in the "nano" range once indentation depth falls at or below 0.2 micrometers — finer than conventional microhardness testing ISO 14577-1.
A typical test runs through three phases:
- Loading: the indenter tip is pressed into the surface under controlled force
- Holding: load is held briefly to allow creep or stress relaxation
- Unloading: the tip retracts while displacement is tracked continuously
Choosing the Right Tip Geometry
Different indenter shapes serve different purposes:
- Berkovich: three-sided pyramid; the standard tip for bulk materials, thin films, and polymers
- Cube corner: sharper geometry that raises local stress, used to induce cracks in brittle materials for toughness studies
- Spherical: rounded tip applied in studies of elastic modulus in human cortical bone
- Flat punch: cylindrical tip for constitutive behavior of viscoelastic solids

The Oliver-Pharr Method
The 1992 Oliver-Pharr paper transformed how researchers extract hardness and modulus from raw load-displacement curves. Rather than optically measuring an indent, the method analyzes the curvature of the unloading data to determine contact depth. With careful technique, reported moduli agreed to within 5% of independent measurements Oliver & Pharr, 1992.
Hardness is calculated as H = Pmax/A, where Pmax is peak load and A is the contact area derived from the unloading curve — no imaging required.
Continuous Stiffness Measurement (CSM) extends the method further. It captures dynamic contact stiffness during loading and builds depth profiles of modulus and hardness—especially useful for layered materials, where properties shift as the tip moves through each layer.

Why Nanoindentation Matters for Research & Quality Control
Nanoscale mechanical data removes guesswork from material selection, coating design, and failure prediction. When you can quantify hardness and modulus at the scale where degradation actually starts, you catch problems before they become field failures.
Key benefits:
- Tests thin films, coatings, and small-volume samples inaccessible to conventional hardness testers
- Detects local heterogeneity within composite and multi-phase materials
- Supports predictive maintenance by flagging degradation, such as thermal barrier coating sintering, before failure
- Delivers hardness, modulus, fracture toughness, and creep data from a single test run
One 2019 nanocomposite study illustrates why localized data matters. Average hardness and elastic-modulus results differed from bulk macro-scale tests by 26.8% and 48.5%, respectively. Those gaps show that nanoindentation exposes heterogeneity a bulk test simply averages away.

Known Limitations
Nanoindentation isn't foolproof. Watch for:
- Surface roughness — final indentation depth should be roughly 20 times the surface roughness; below a 3:1 ratio, variability climbs sharply
- Tip-dependent results — a worn Berkovich tip can grow from roughly 150 nm to 250 nm in radius over a year of use, skewing area-function calculations
- Viscoelastic and soft materials — hardness values for creep-prone or viscoelastic samples depend heavily on test duration, per ISO 14577-4
How Nanoindentation Works — Step by Step
Accurate results depend on careful execution at every stage. Most errors trace back to shortcuts taken in prep or calibration.
Step 1: Sample Preparation & Surface Finish
Achieve a flat, smooth surface. As a screening heuristic, indentation depth should be roughly 20 times the surface roughness to avoid skewed results.
Step 2: Indenter & Load Selection
Match tip geometry and load range to the target property:
- Berkovich for general hardness and modulus
- Cube corner for fracture toughness
- Flat punch for viscoelastic behavior
Step 3: Loading, Holding & Unloading Cycle
Apply controlled load with sub-nanometer displacement sensing and micronewton force resolution. Hold briefly to capture creep or stress relaxation before unloading.
Step 4: Data Capture & Environmental Control
Isolate vibration and thermal drift. For thin films specifically, keep indentation depth under roughly 10% of coating thickness to avoid substrate influence. That rule gets harder to satisfy below 200 nm film thickness, as noted in a Bruker application note.
Step 5: Applying Oliver-Pharr / CSM Analysis
Extract hardness, modulus, and depth profiles directly from the load-displacement curve. Continuous stiffness measurement (CSM) adds property-versus-depth data in a single indent.
Step 6: Interpret & Validate Results
Cross-check tip calibration and the contact-area function against known reference materials before drawing conclusions. Skipping this step is one of the most common causes of unreliable published data.

How Molecular Imaging Supports Nanoscale Mechanical Characterization
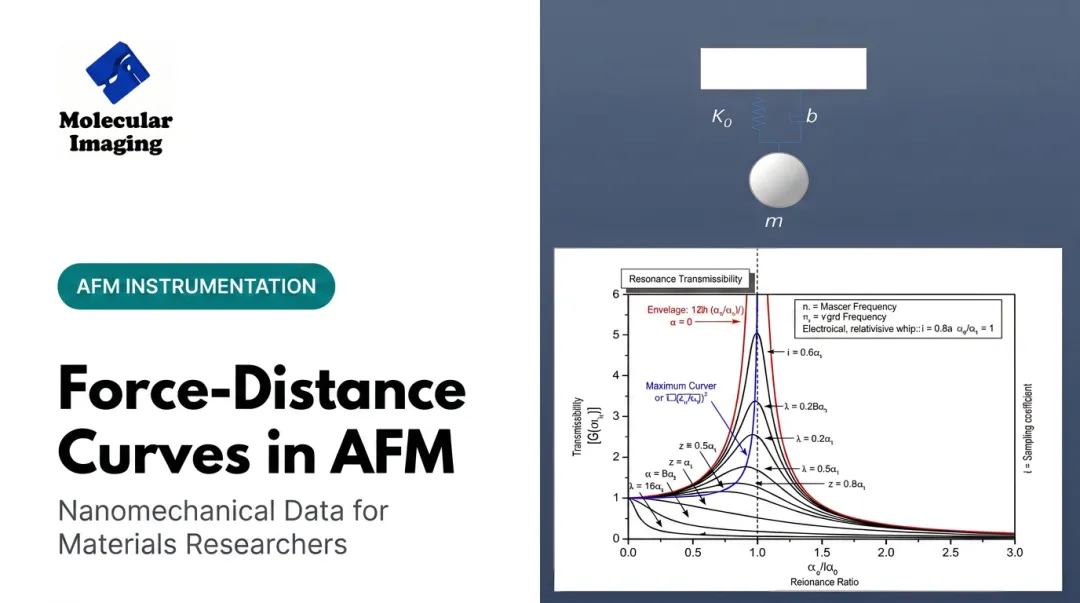
Nanoindentation and AFM-based force spectroscopy target the same goal: local mechanical properties at small length scales. Molecular Imaging's AFM/SPM systems — including the 5500 PicoPlus AFM+STM and 5420 PicoAFM — generate force-distance curves that complement dedicated nanoindentation instruments, particularly for soft, biological, or liquid-immersed samples.
The 5500 ILM PicoPlus BioAFM system runs MAC Mode for soft materials in fluids, with documented applications in cell mechanics research and biomolecular interaction studies. PicoView software supports volume spectroscopy and FlexGrid spectroscopy for spatially resolved force mapping.
For testing under varied conditions, temperature-controlled stages span -30°C to 250°C with a patented anti-drift design, and the PicoPlus 5500 Series Environmental Isolation Chamber controls humidity, temperature, and gas composition. That combination supports phase-transition and thermal-degradation studies where stiffness and adhesion shift with temperature.

Researchers running these studies also have access to:
- 500 nm grating calibration samples for verifying scanner and positioning accuracy
- Pulsed Force Mode documentation covering force-distance acquisition
- ZoomAFM calibration, repair, and troubleshooting for Agilent 5500 and 4500 platforms
Conclusion
Nanoindentation gives researchers precise, localized mechanical data that bulk hardness testing can't match. That resolution is critical for thin films, coatings, composites, and biological samples.
As sample types and research questions evolve, revisit test protocols and instrumentation regularly rather than treat setup as a one-time decision.
Frequently Asked Questions
What is a nanoindentation test used for?
It measures hardness, elastic modulus, and other mechanical properties of thin films, coatings, and small-volume materials that traditional hardness testers can't accurately assess. It's especially valuable for localized or layered samples.
What is the Oliver-Pharr method used for in nanoindentation?
It extracts hardness and elastic modulus directly from the unloading portion of a load-displacement curve. This eliminates the need for optical measurement of the leftover indent.
How is nanoindentation different from traditional hardness testing?
Nanoindentation continuously tracks force and displacement throughout the test, while traditional testing measures the indent optically after the fact. This makes nanoindentation far more precise at small scales.
Can nanoindentation measure properties other than hardness?
Yes. It can also determine elastic modulus, fracture toughness, creep behavior, and viscoelastic properties, often from a single test cycle.
What industries rely most on nanoindentation testing?
Semiconductors, aerospace coatings, biomedical materials, and polymers all depend on nanoindentation for quality control and R&D. Each field uses it to evaluate small-scale or layered material behavior.
What are common sources of error in nanoindentation measurements?
Surface roughness, thermal drift, poor tip calibration, and substrate effects on thin films are the most frequent error sources. Careful sample prep and regular calibration against reference materials minimize these issues.