
Introduction
Standard AFM topography shows you the shape of a surface. It can't tell you where charge accumulates, which regions are more conductive, or how a dopant gradient runs through a device. Many researchers hit this wall the moment their samples stop being about shape and start being about function — semiconductors, memristors, molecular junctions.
That's the gap Electric Force Microscopy (EFM) fills. It's a dynamic, non-contact AFM mode that maps electrostatic force gradients to reveal charge distribution, surface potential contrast, and material differences at the nanoscale, all without touching the sample.
This article covers how EFM works and how it compares with KPFM, C-AFM, and MFM. You will also see where it is used in current research and what it takes to collect clean, reliable data.
Key Takeaways
- EFM detects electrostatic force gradients without tip-sample contact, protecting delicate samples.
- Expect qualitative electrical contrast, not absolute voltage values; pair EFM with KPFM for quantitative CPD.
- Use phase detection as the standard signal method—amplitude detection is largely outdated.
- Protect data quality by controlling tip coating condition, lift height, and humidity.
What Is Electric Force Microscopy (EFM)?
EFM is a dynamic, non-contact AFM mode. A conductive-coated cantilever oscillates above the sample and detects long-range electrostatic forces rather than physically probing the surface.
Those forces come from separated charges attracting or repelling each other—the same Coulomb interaction familiar from electrostatics, measured at nanometers instead of meters.
According to the Wikipedia entry on electrostatic force microscopy, these interactions are detectable at separations of 100 nm or more from the surface, well beyond the range where van der Waals and mechanical forces dominate. That distance matters: it's what lets EFM isolate electrical behavior from topographic noise.
How EFM differs from standard tapping mode:
- Tapping mode measures mechanical surface properties through direct or intermittent contact.
- EFM uses a two-pass approach to separate electrical signal from mechanical interference.
- Tapping mode produces a height map; EFM produces a phase or frequency-shift map showing relative electrical contrast.
EFM gives you qualitative contrast, not calibrated voltage numbers. Per Oxford Instruments/Asylum Research's guide to electrical AFM tools, conventional EFM maps relative differences in charge, potential, conductivity, or permittivity.
That makes it useful for spotting where something electrically interesting is happening, less so for saying exactly how much—a distinction that sets up the comparison with KPFM later in this article.
EFM shows up regularly in semiconductor and nanoelectronics research, including dopant profiling in transistor structures and charge-migration studies in switching devices. It's become a standard tool anywhere researchers need to see electrical behavior that topography alone can't explain.

How Electric Force Microscopy Works
The force EFM measures comes down to a fairly simple relationship. Treating the tip and sample as a capacitor, the electrostatic force is:
F = ½ (dC/dz) ΔV²
Here, dC/dz is the capacitance gradient between tip and sample, and ΔV is the applied voltage difference. The bigger either factor gets, the stronger the force the cantilever feels.
That force also changes how the cantilever responds to its own oscillation. An attractive force gradient softens the effective spring constant, lowering the resonance frequency.
A repulsive or stiffening gradient pushes resonance the other way. This frequency shift is the signal EFM captures.
Dual-Pass (LiftMode) Measurement
EFM almost always runs as a two-pass scan, often called LiftMode:
- First pass — the tip runs in standard tapping or contact mode, recording topography line by line.
- Second pass — the tip lifts to a user-defined height and retraces that exact stored profile, this time with a bias voltage applied.
Because the second pass follows the stored topography rather than the raw surface, it holds the tip-sample distance constant. That's what strips out mechanical and van der Waals contributions and leaves you with a cleaner electrostatic signal.
Signal Detection Methods
Three approaches exist for reading that resonance shift, and they're not interchangeable:
- Phase detection — most common method; tracks phase lag between drive signal and cantilever response. Larger lag means a stronger force gradient. Fast and more tolerant of height variation than amplitude (Bruker's EFM application note).
- Frequency modulation (FM) — a feedback loop adjusts drive frequency to hold phase constant, directly tracking resonance-frequency shift. More quantitative, but requires more sophisticated electronics.
- Amplitude detection — a legacy method. It infers resonance shift indirectly through amplitude change, which makes it slower and more sensitive to sample-height variation. Most labs have moved away from it.

EFM vs. Other AFM-Based Electrical Modes
EFM is one of several electrical AFM techniques, and choosing the right one depends on what question you're actually asking.
EFM vs. KPFM: EFM measures force gradient and reports qualitative contrast. Kelvin Probe Force Microscopy (KPFM) goes a step further. It applies DC feedback to null the electrostatic force entirely, and the nulling voltage becomes a direct, quantitative measurement of contact potential difference (CPD). If you need an actual surface potential value in volts, KPFM is the tool, not EFM.
EFM vs. C-AFM: Conductive AFM requires the tip to physically touch the sample to measure current flow, typically in the picoamp-to-microamp range depending on the module. That contact enables direct conductivity mapping but risks scratching or degrading soft or delicate films. EFM's lifted, non-contact geometry avoids that risk entirely, at the cost of not measuring current directly.
EFM vs. MFM: Magnetic Force Microscopy shares EFM's dual-pass mechanics almost exactly, but the cantilever is magnetized rather than conductively coated, and it senses magnetic rather than electric field gradients. The measurement logic is nearly identical — only the physics and tip preparation change.
| Mode | Contact Type | Signal Measured | Best-Fit Application |
|---|---|---|---|
| EFM | Non-contact (lifted) | Electrostatic force gradient (phase/frequency shift) | Qualitative charge and potential mapping |
| KPFM | Non-contact (lifted, with nulling feedback) | Contact potential difference (CPD) | Quantitative surface potential and work function |
| C-AFM | Direct contact | Current (pA–µA range) | Local conductivity, current pathways |
| MFM | Non-contact (lifted) | Magnetic force gradient | Domain structure, magnetic storage media |
Researchers rarely rely on just one of these in isolation. In a widely cited study on memristive switching, Yang et al. (Nature Communications) combined C-AFM and EFM on HfO₂/TiN structures. C-AFM electrically stressed the device while EFM detected oxygen-ion migration before switching occurred, with the ionic signal persisting for over 75 minutes.

Pairing modes like this builds a far more complete picture than any single technique offers alone.
Applications of EFM in Nanoscale Research
Semiconductor and Neuromorphic Devices
EFM is a primary tool for probing the mechanisms behind next-generation neuromorphic computing in resistive RAM and memristive devices:
- Charge migration
- Oxygen-ion motion
- Filament formation
Cryogenic EFM has also profiled dopant distribution in ion-implanted bipolar transistor structures. Researchers get a spatial map of where doping actually landed versus where it was intended.
Molecular Electronics
Mapping charge distribution across individual molecules and molecular junctions is central to understanding charge transport at the smallest scale.
High-resolution electrostatic imaging has reconstructed electric field maps of single molecules on metal substrates. Those maps align closely with theoretical predictions, giving researchers a way to validate models against measured data.
Materials Science and Thin Films
EFM characterizes several surface and film properties in polymers and nanostructured coatings:
- Dopant distribution
- Work-function contrast between materials
- Trapped surface charge
It has also visualized sub-microsecond charge migration in photoexcited organic bilayers and tracked trapped charge ejected from thin-film transistor channels. That data helps diagnose device degradation.
Across semiconductors, molecular junctions, and thin films, EFM turns electrostatic contrast into actionable maps of charge behavior. Labs running these experiments typically pair an EFM-capable AFM platform with conductive cantilevers designed for electrostatic modes.
Key Considerations for Reliable EFM Imaging
Getting clean EFM data depends on a handful of practical factors that are easy to overlook.
- Tip and cantilever selection: Conductive-coated cantilevers, typically Pt-coated or Cr/Au-coated, are required for EFM. Coating wear from repeated scans changes the effective tip radius over time, which shifts measurement accuracy without an obvious warning sign.
- Sample and environmental conditions: EFM works on conducting, insulating, and mixed samples, but it performs best on smooth topography in low-humidity environments. Rough surfaces and ambient moisture both introduce artifacts that can look like real electrical contrast.
- Interpretation limits: EFM gives you relative, qualitative contrast only. If your research question needs absolute surface potential values, pair EFM with KPFM rather than trying to extract quantitative numbers from EFM data alone.
- Lift height: Too low reintroduces topographic crosstalk; too high weakens the electrostatic signal and smears it laterally. Most setups start in the tens-of-nanometers range and refine through trial at multiple heights.

Choosing the Right AFM System for EFM Research
Reliable EFM work depends less on any single spec sheet number and more on system flexibility. You need a platform that can switch between phase detection, frequency modulation, and dual-pass configurations without fighting the hardware to do it.
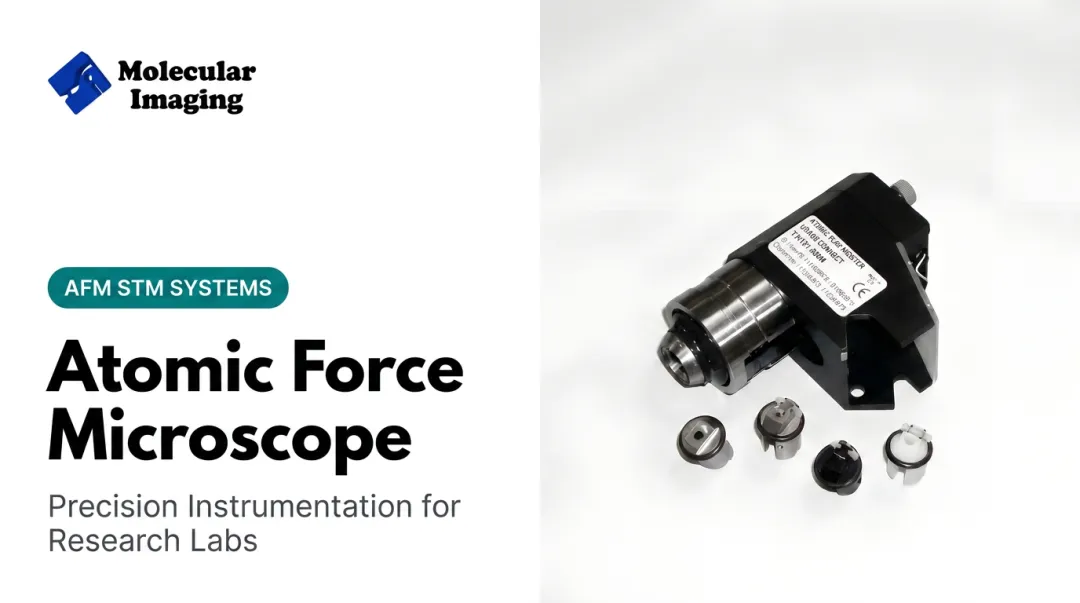
Molecular Imaging's 5500 PicoPlus AFM+STM platform uses interchangeable nose cones to move between AFM, STM, tapping mode, KPFM, EFM, and MFM without swapping out the entire system. For labs working across molecular electronics, materials science, and life sciences, that modularity means one instrument can support several research directions instead of a dedicated system for each mode.
complementary pieces for EFM work include:
- EFM-10 cantilever, purpose-built for EFM and KPFM on electronic materials and semiconductor surfaces
- ZoomAFM service for diagnostics, calibration, and platform-matched replacement parts on legacy 5500-series systems still running after Keysight's 2018 exit from the AFM market
If you're troubleshooting an EFM setup or deciding whether your current instrument can handle it, modular hardware plus legacy support is worth a conversation before you invest in something new.
Frequently Asked Questions
What is the difference between EFM and KPFM?
EFM measures electrostatic force gradients and yields qualitative contrast. KPFM uses DC feedback to null that force, delivering a quantitative contact potential difference instead.
Does EFM require the tip to contact the sample?
No. EFM's electrical measurement happens during the lifted second pass, keeping the tip well above the surface and avoiding physical contact or sample damage.
Can EFM be used on non-conductive samples?
Yes. EFM senses field gradients from applied voltage or trapped charge, so it works on conductive, non-conductive, and mixed samples—not only samples that carry current.
What is "lift height" in EFM imaging?
Lift height is the user-set vertical offset between the stored first-pass topography and the second-pass electrical scan. It's tuned to sense electrostatic forces while minimizing topographic interference.
Can EFM measure absolute surface potential values?
No. EFM only provides relative, qualitative contrast. Absolute surface potential requires KPFM's nulling feedback approach for a true quantitative reading.
Is EFM suitable for imaging samples in liquid?
Only in non-conductive liquids. Conductive or ionic liquids short-circuit the tip-sample potential difference, which defeats the electrostatic measurement entirely.